Simulating real-world systems
What you now know
We started this collection of posts with a question: why simulate real-world systems at all?
The answer: simulations can help us discover better actions to take in our decision-making and interrogate the reasoning behind a decision in ways other predictive AI approaches cannot match.
From this point onward, we built up our understanding in layers.
State partitions and timesteps gave us a way to describe how a system evolves in time; these are the fundamental building blocks.
Probabilistic thinking gave us a way to reason about its possible trajectories without enumerating them.
Objectives and learning algorithms gave us a way to fit parameters to data.
What’s next?
The four layers we’ve built up (building blocks, probabilities, learning, decisions) all fit together into a real piece of software.
The stochadex project is built on exactly these foundations, and the examples below describe interactive dashboards built with it. Each one is devoted to a specific real-world decision problem.
Note: if you’re curious how all this runs on different kinds of hardware, there’s a separate post on simulation architectures.
Example: Evaluating rugby manager decision-making
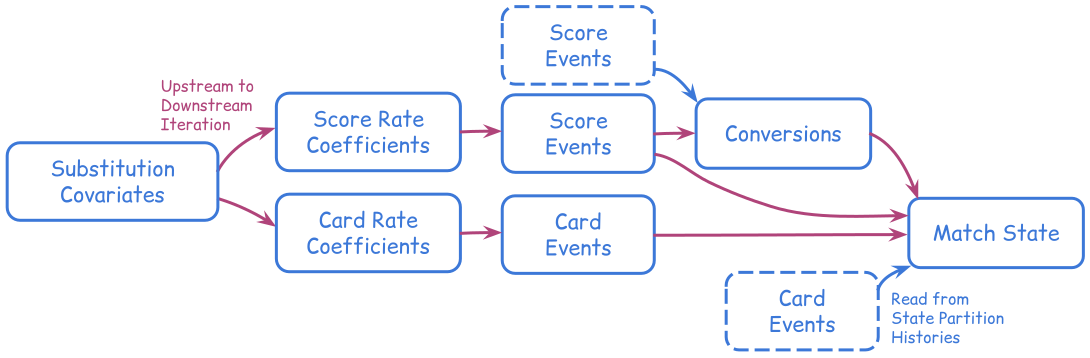
A rugby manager picks when to substitute each position group; early relief versus late impact.
The simulation models how those choices affect the match state and can therefore be used to derive the win probability over multiple trajectories. It can also be fitted to real match events.
The link to the interactive dashboard for this example can be found here.
Example: Managing antimicrobial resistance (AMR) with hospital guidelines
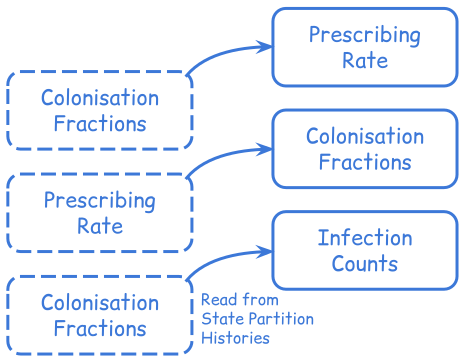
A medicines management committee picks a cephalosporin prescribing policy; keep pressure high and resistance builds inside the wards, ease off and prevent some of that buildup.
The simulation models how those choices shape the resistant E. coli fraction in a hospital and the bloodstream infections that follow. It can also be fitted to real surveillance data.
The link to the interactive dashboard for this example can be found here.
Example: Managing flood damage risk under climate change
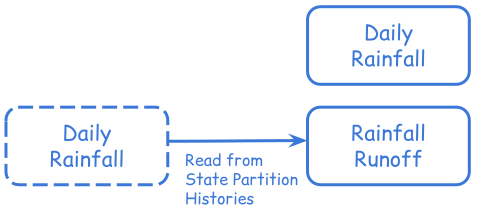
A catchment authority picks a portfolio of natural flood management interventions; pay more upstream and trim peak flows downstream, or save the money and accept the climate-driven rise.
The simulation models how those choices shape downstream peak flow distributions under different climate scenarios. It can also be fitted to real Environment Agency flow records.
The link to the interactive dashboard for this example can be found here.
Example: Energy demand response optimisation for the national grid
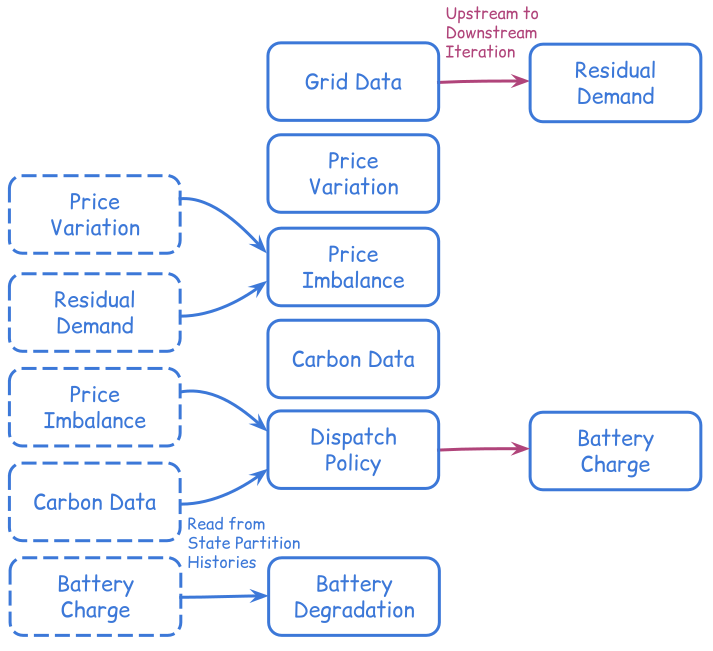
A battery operator picks a dispatch policy; chase the price spreads of today’s grid, or chase the carbon swings of a renewables-heavy one.
The simulation models how those choices shape the battery’s revenue, degradation, and carbon savings under different grid mixes. It can also be fitted to real NESO half-hourly demand data.
The link to the interactive dashboard for this example can be found here.
Example: Support policies for small business survival
A local policymaker picks a small business support portfolio; tilt towards rates relief to keep more young firms alive, or tilt towards startup grants to grow the register count.
The simulation (here just one simple state partition) models how those choices shape five-year cohort survival and register stock under different macro scenarios. It can also be fitted to real ONS business demography and Companies House register data.

The link to the interactive dashboard for this example can be found here.